Self-paced teacher training
Get your class started on the Test Bank
Work through these steps with the site open in another tab. Each step has a short task to try. Tick it off when you’re done, and your progress stays on this device.
Step 1
Create your account and pick your course
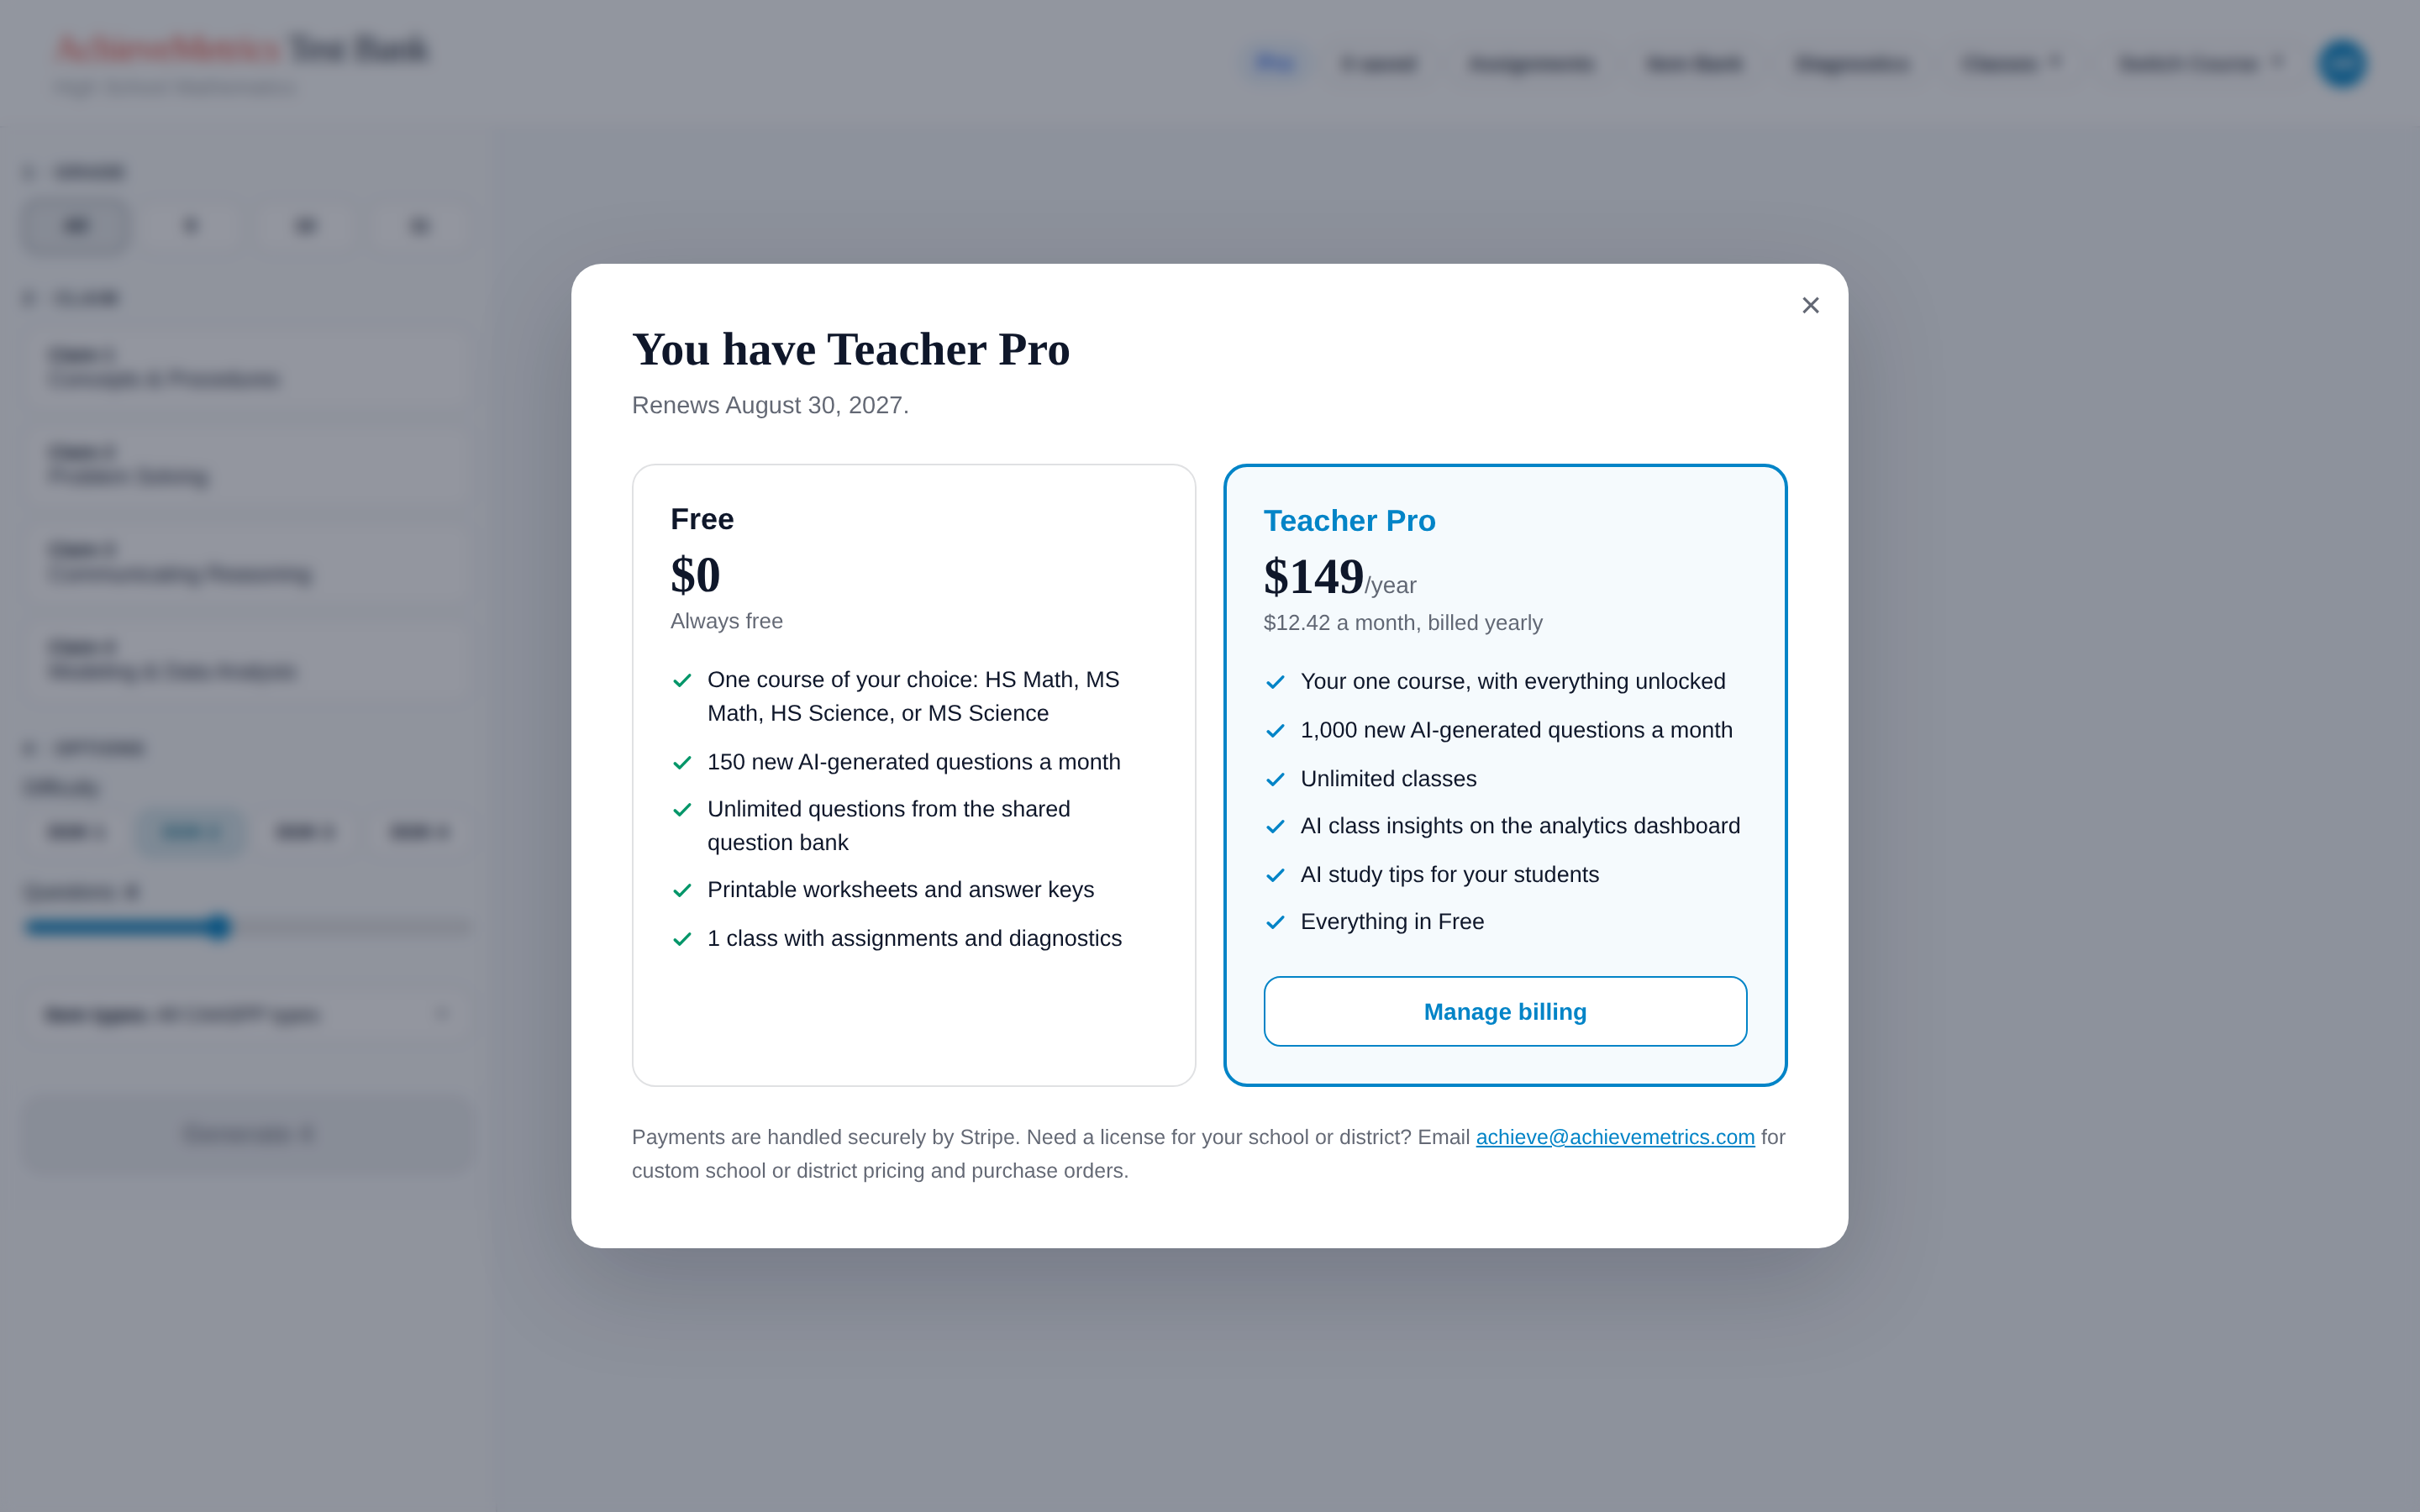
Go to achievemetricstestbank.com and choose Start free as a teacher. Sign in with your school email or Google. The first time you sign in, you pick one course: HS Math, MS Math, HS Science, or MS Science. That choice is fixed for your account, so pick the one you teach most. If your school has a license or you need a second course, email achieve@achievemetrics.com.
Try it
Step 2
Make a class and bring students in
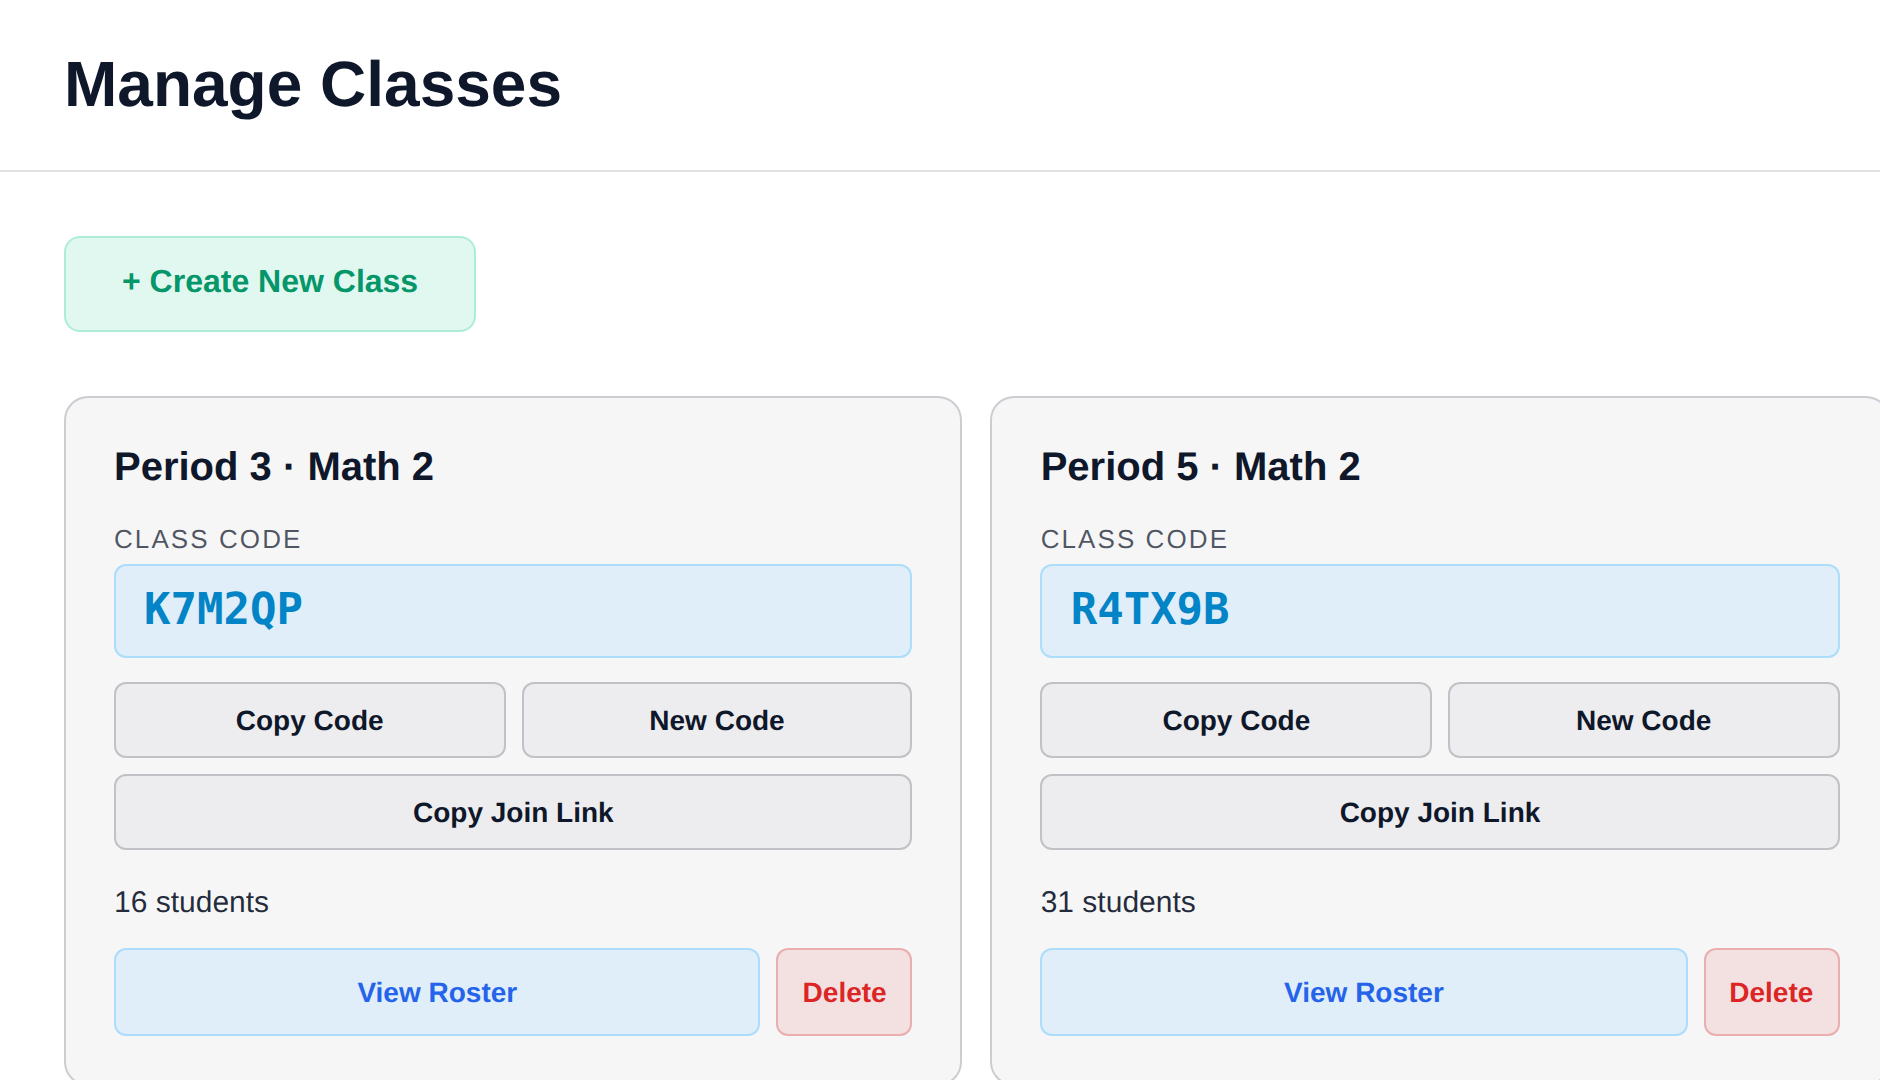
- In the top bar, open Classes → Manage Classes → Create New Class.
- Copy the class code, or Copy Join Link to post in your LMS.
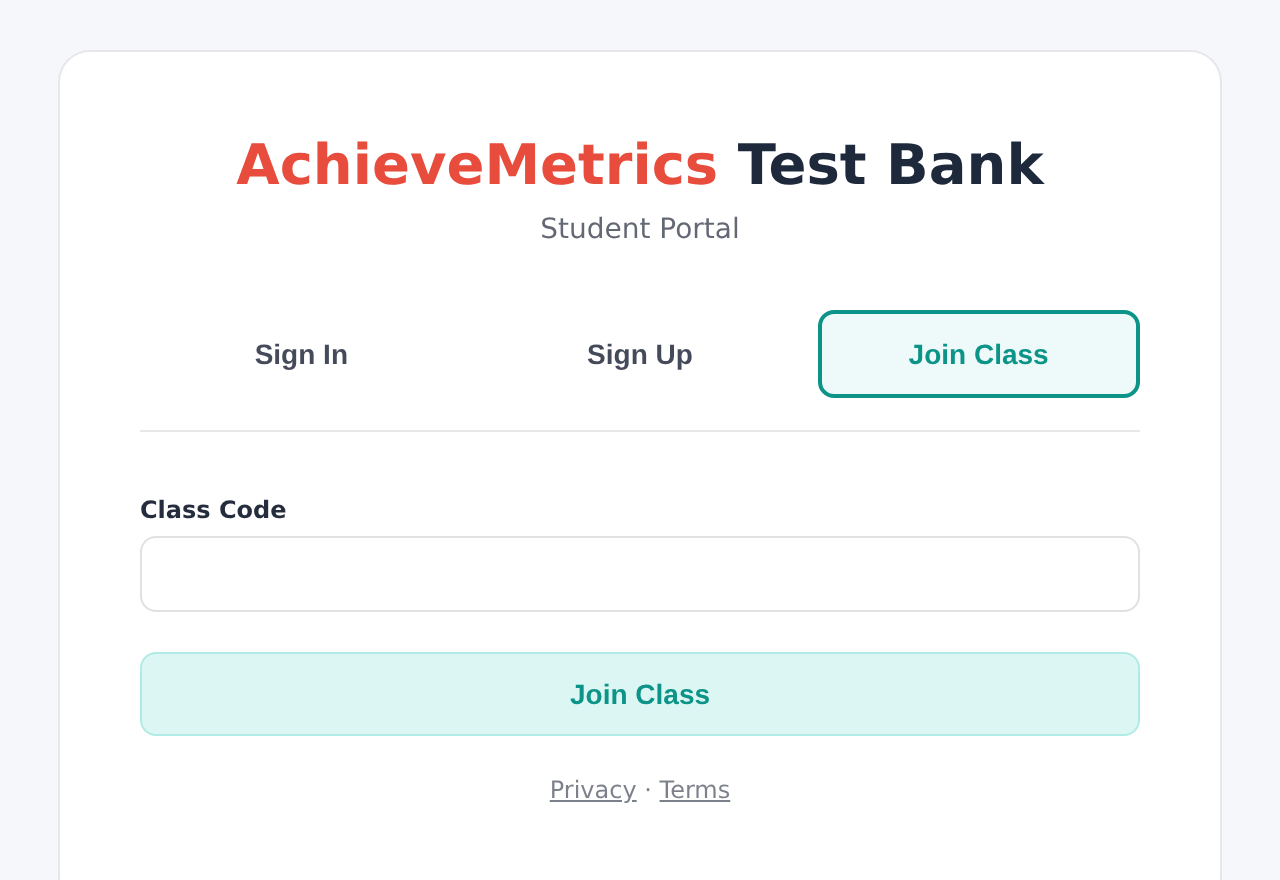
- Students go to achievemetricstestbank.com/student, sign up, and choose Join Class.
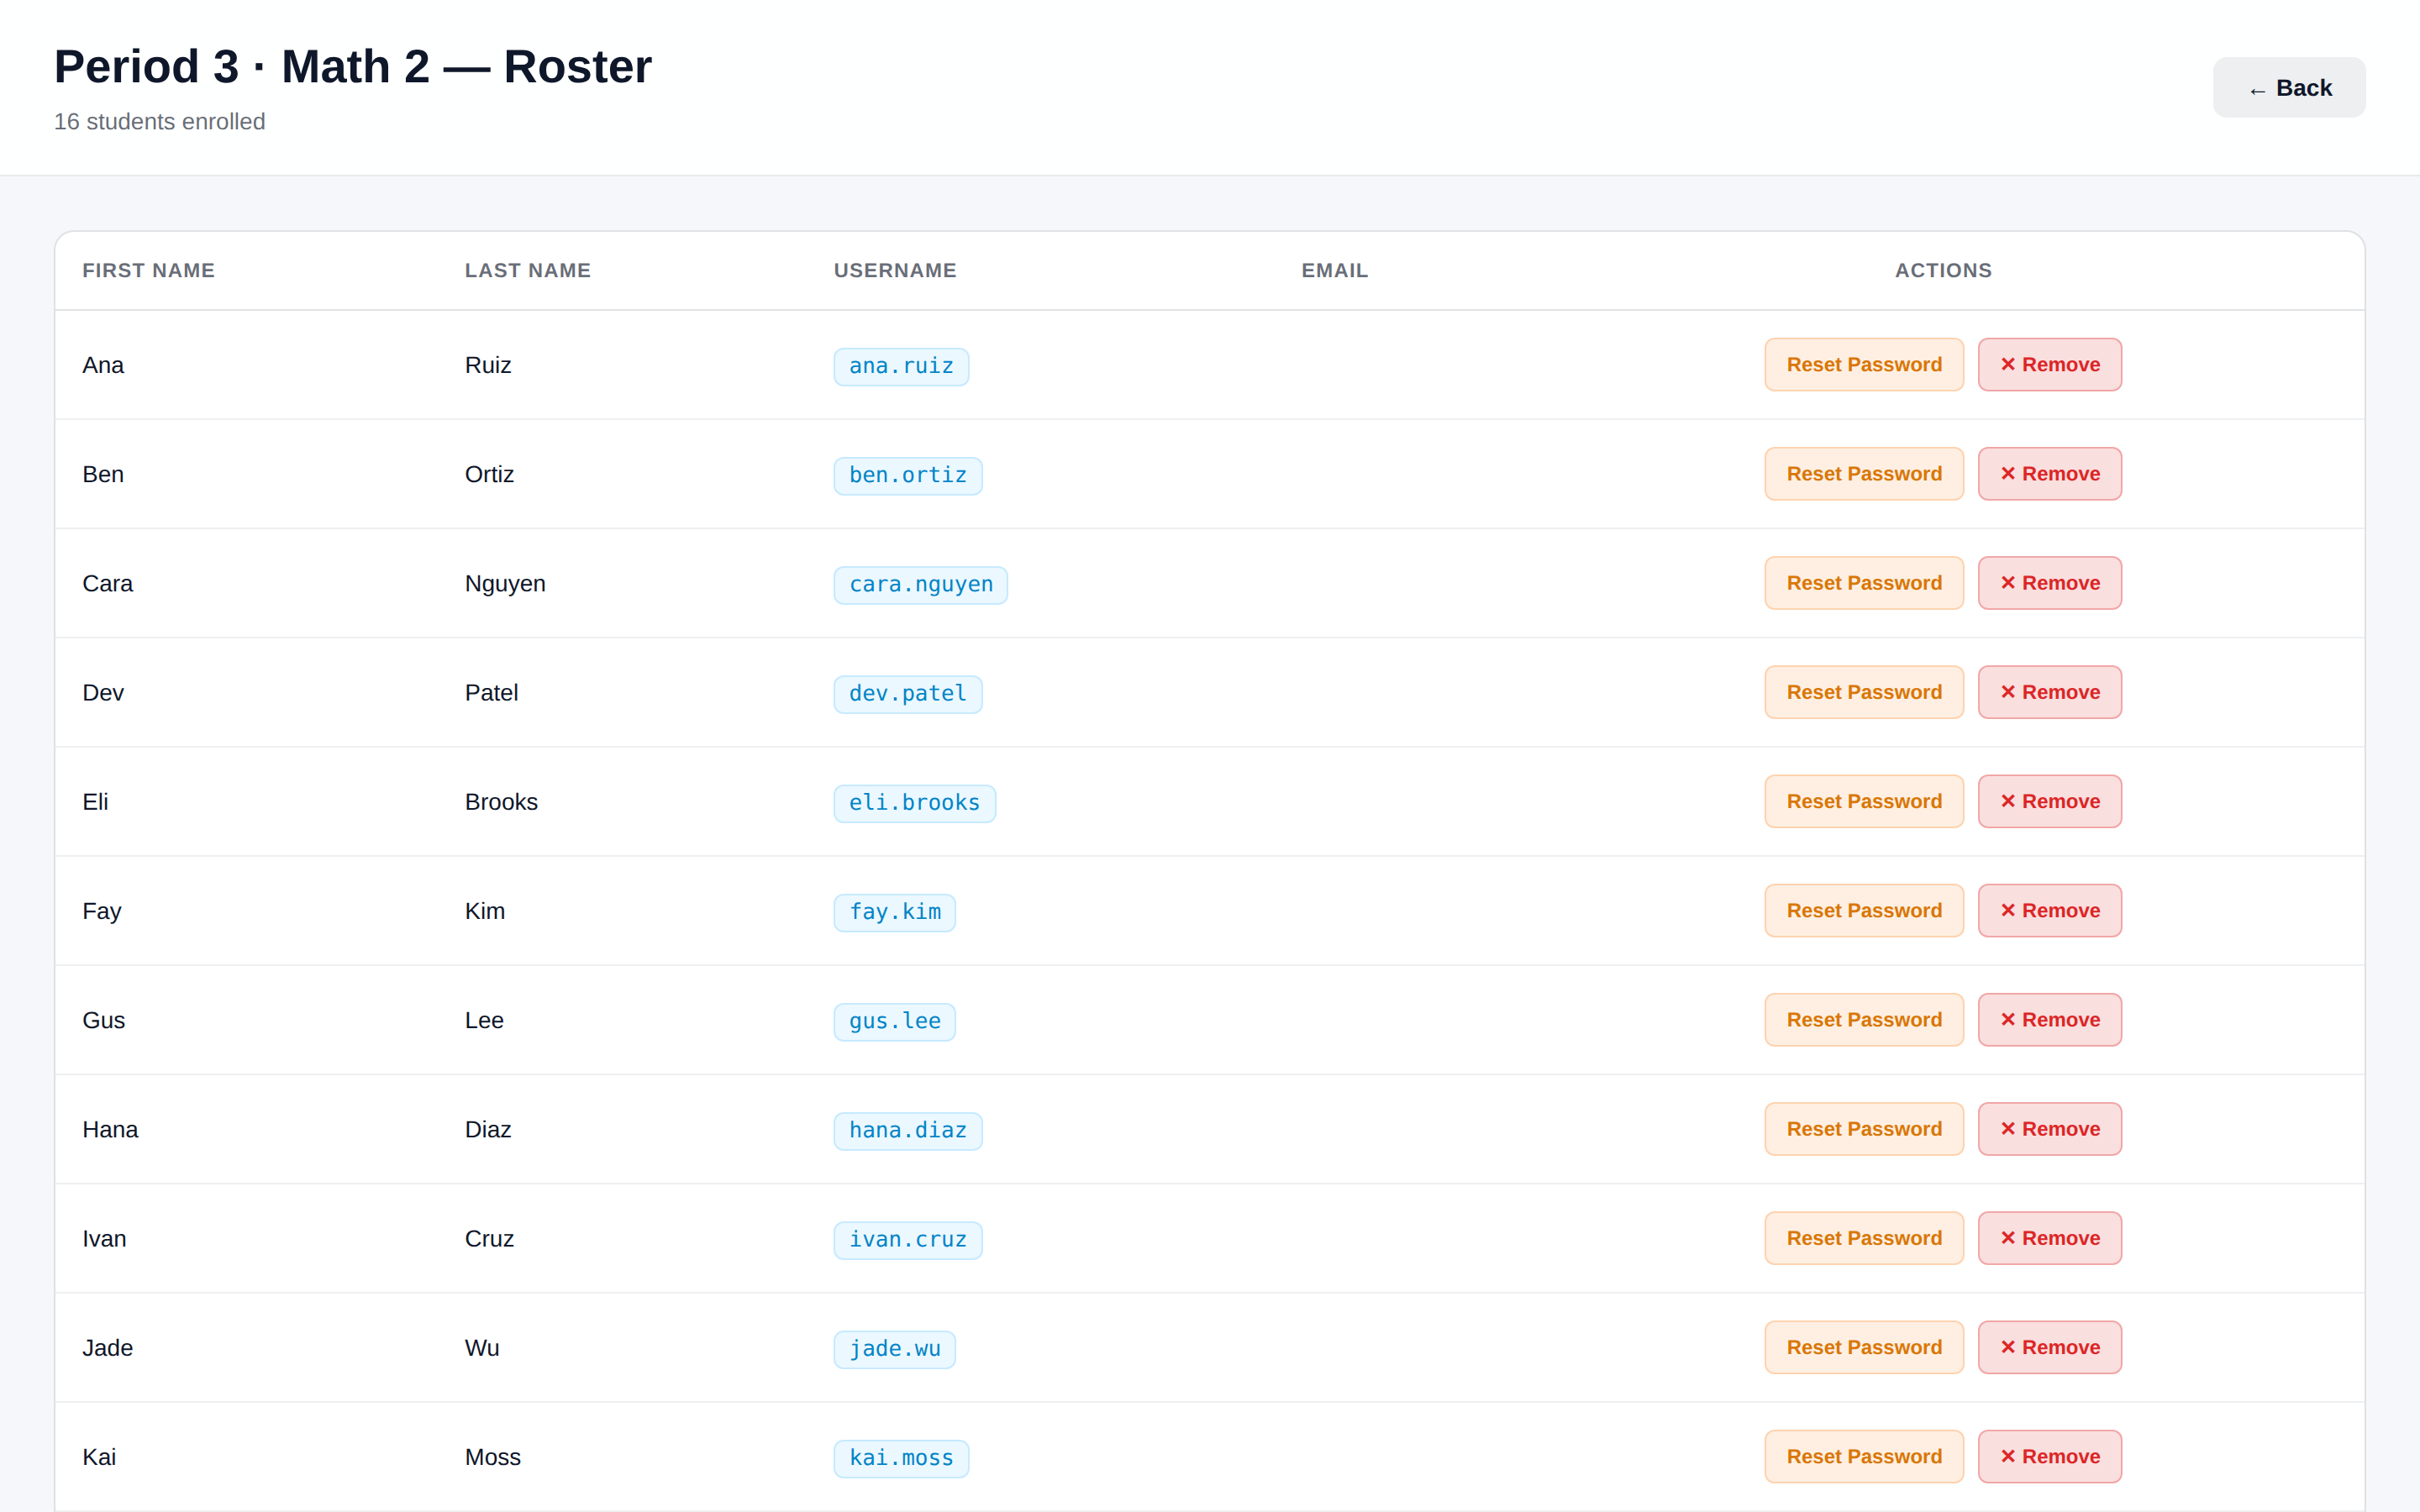
- View Roster shows who joined. You can reset a forgotten password there.
Try it
Step 3
Generate CAASPP-style questions
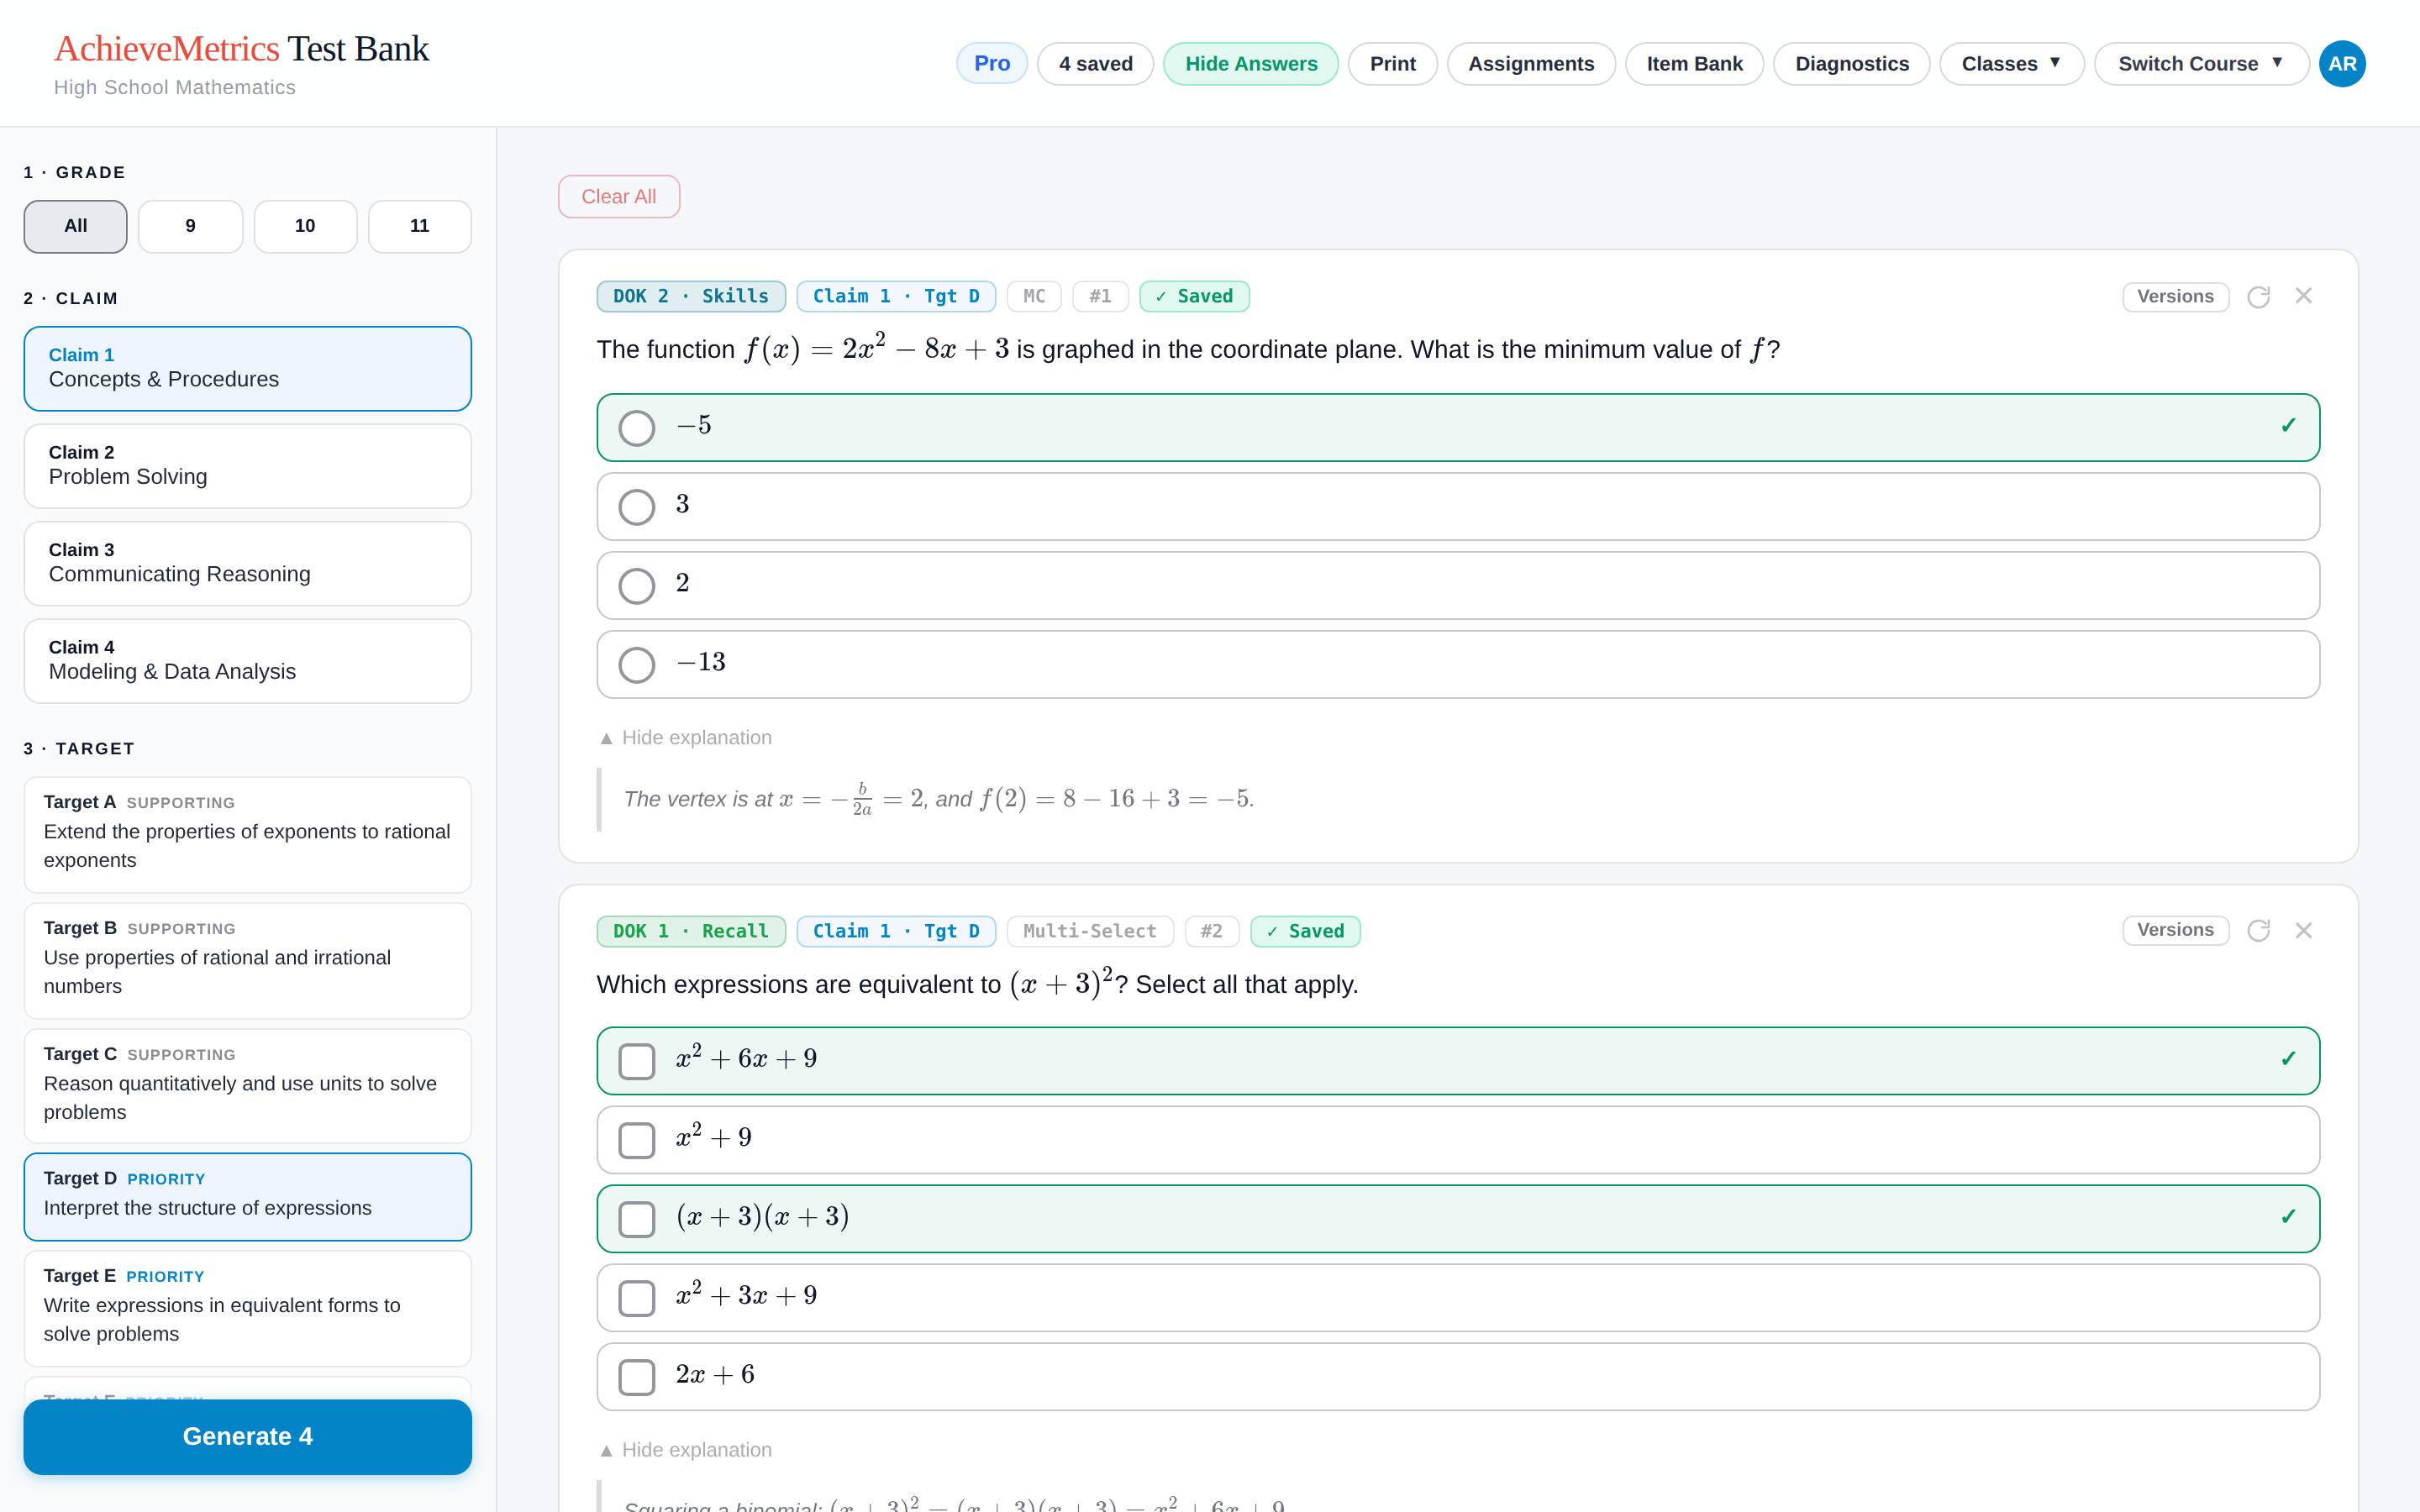
Pick a grade, a claim, and a target on the left, then set the DOK level and item types. Click Generate. Show Answers reveals the keys and explanations. Versions makes a parallel question on the same target, and ↻ replaces one you don’t like. Questions from the shared bank are free and never count toward your monthly limit.
Try it
Step 4
Save, reuse, and print
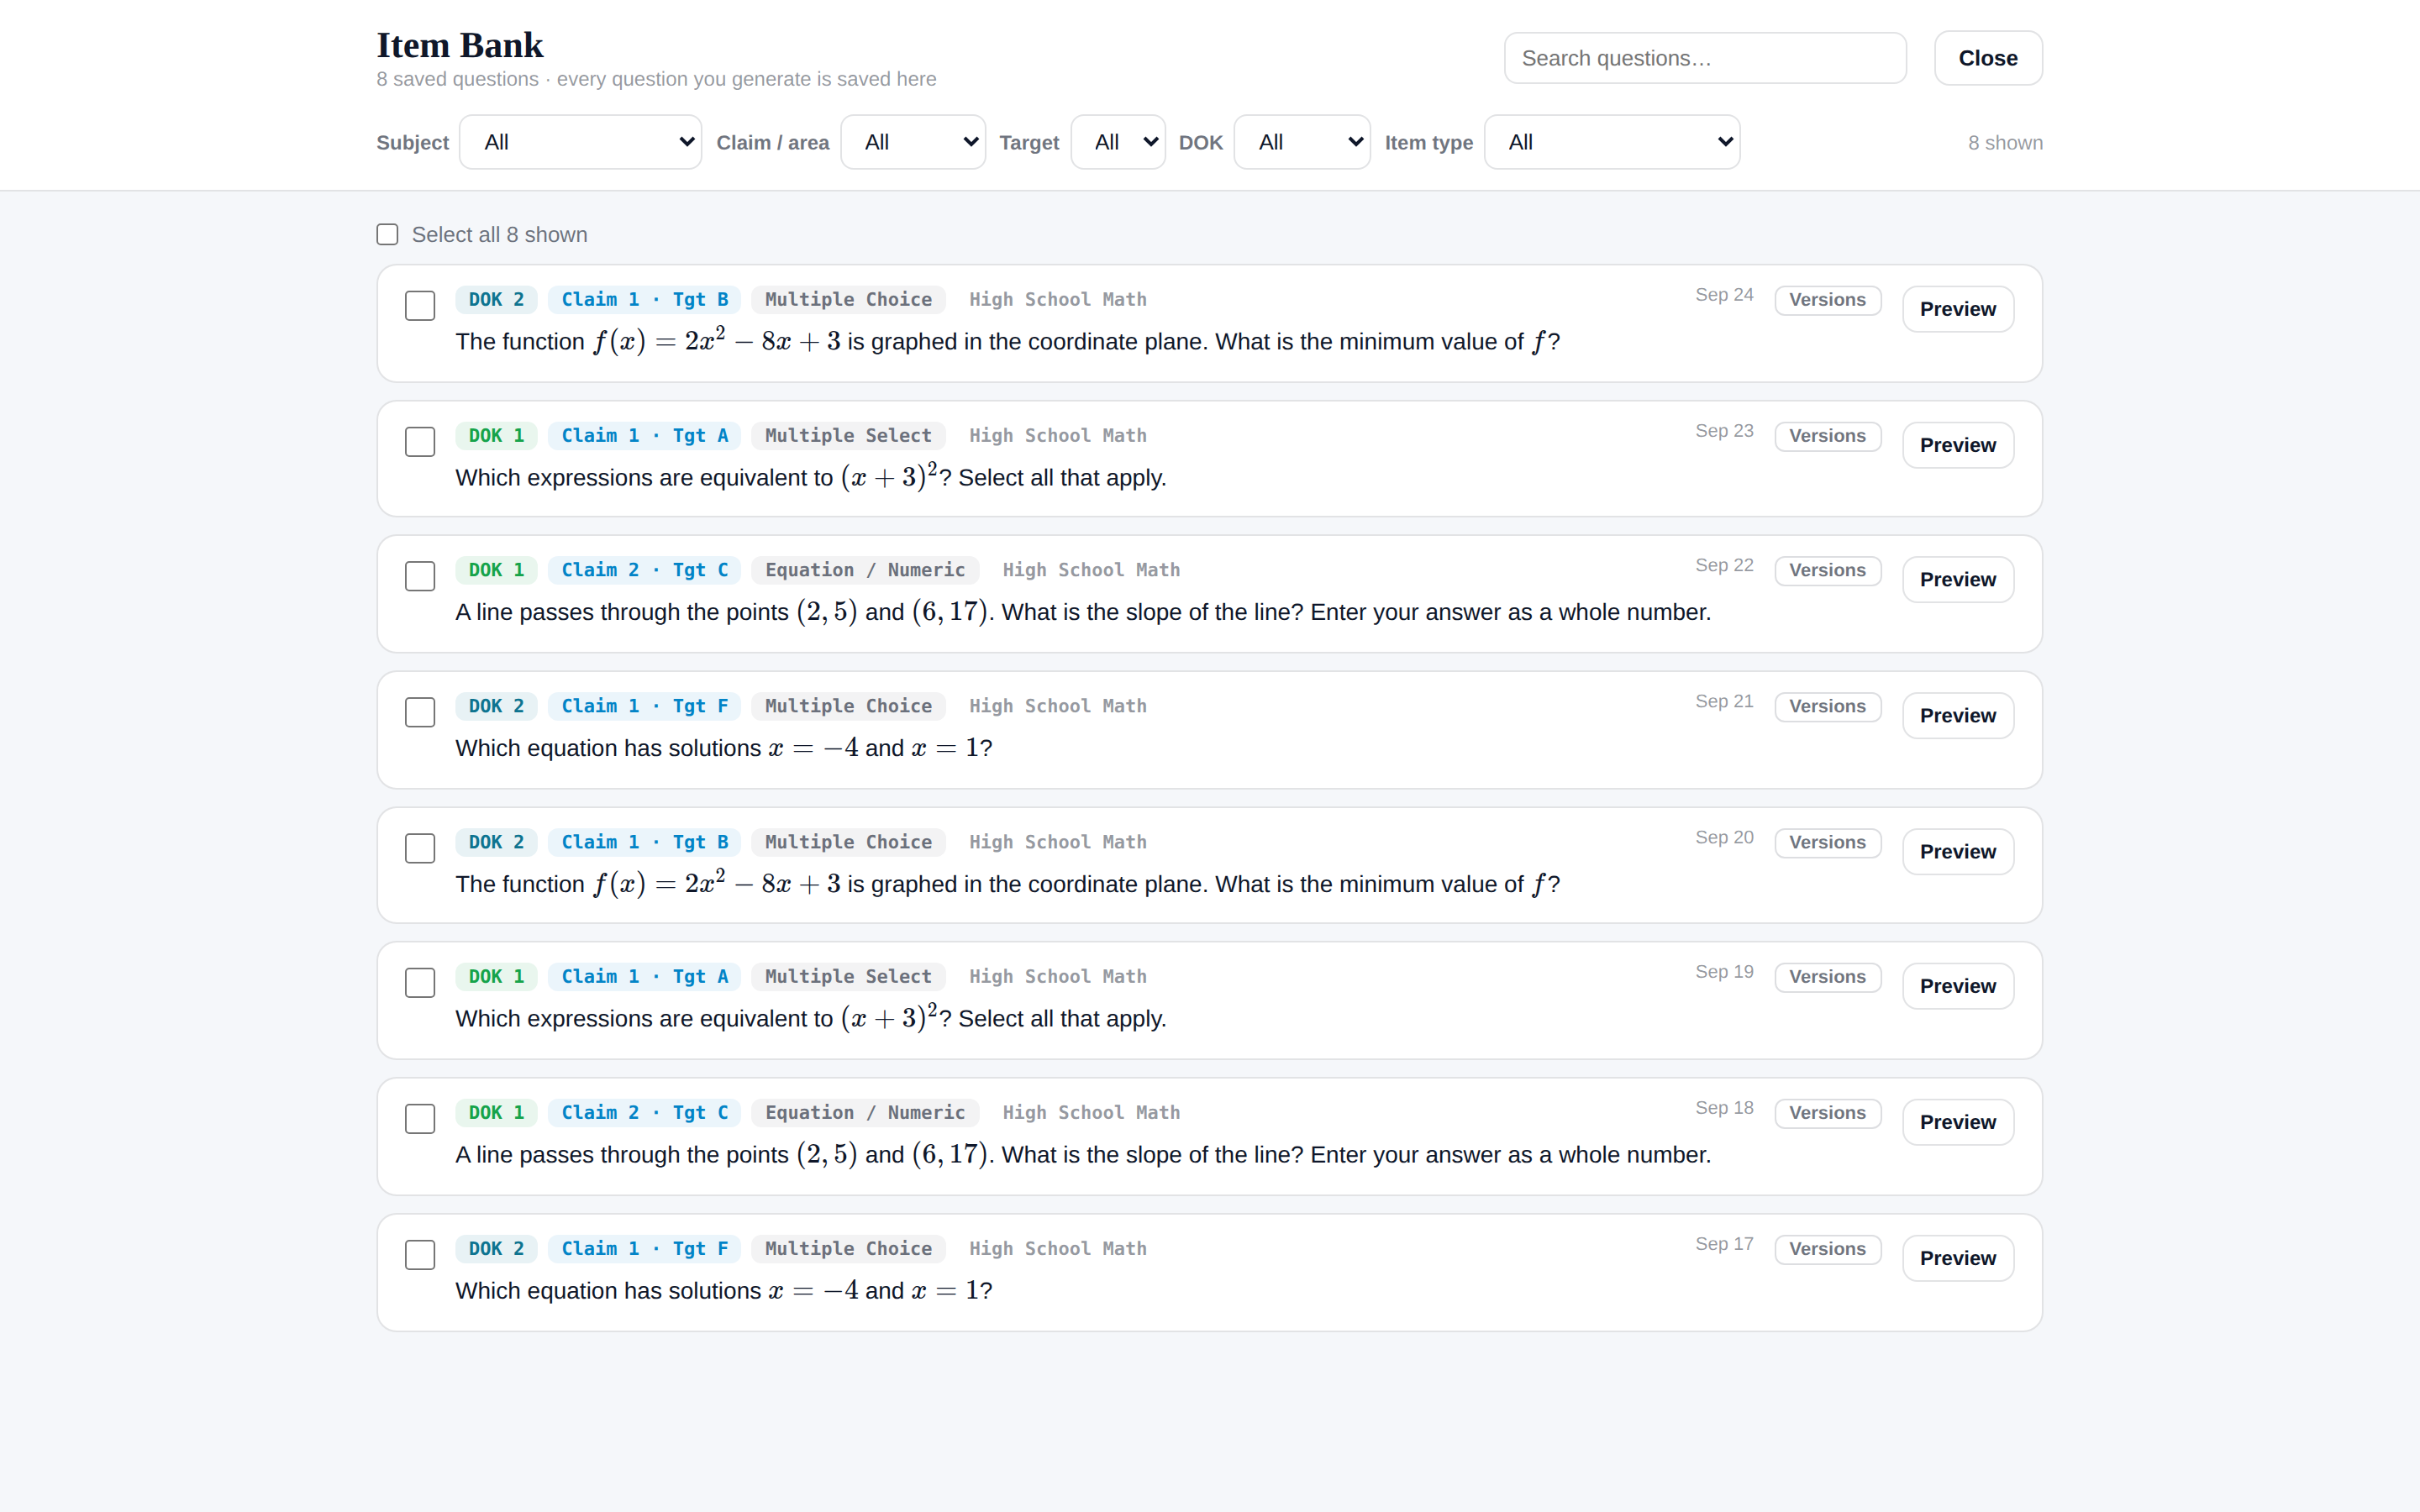
Everything you generate is saved to your Item Bank. Filter it by claim, target, DOK, or item type. If a question is wrong or confusing, report it and it’s replaced. Print makes a worksheet and a separate answer key.
Try it
Step 5
Assign a set and let it score itself
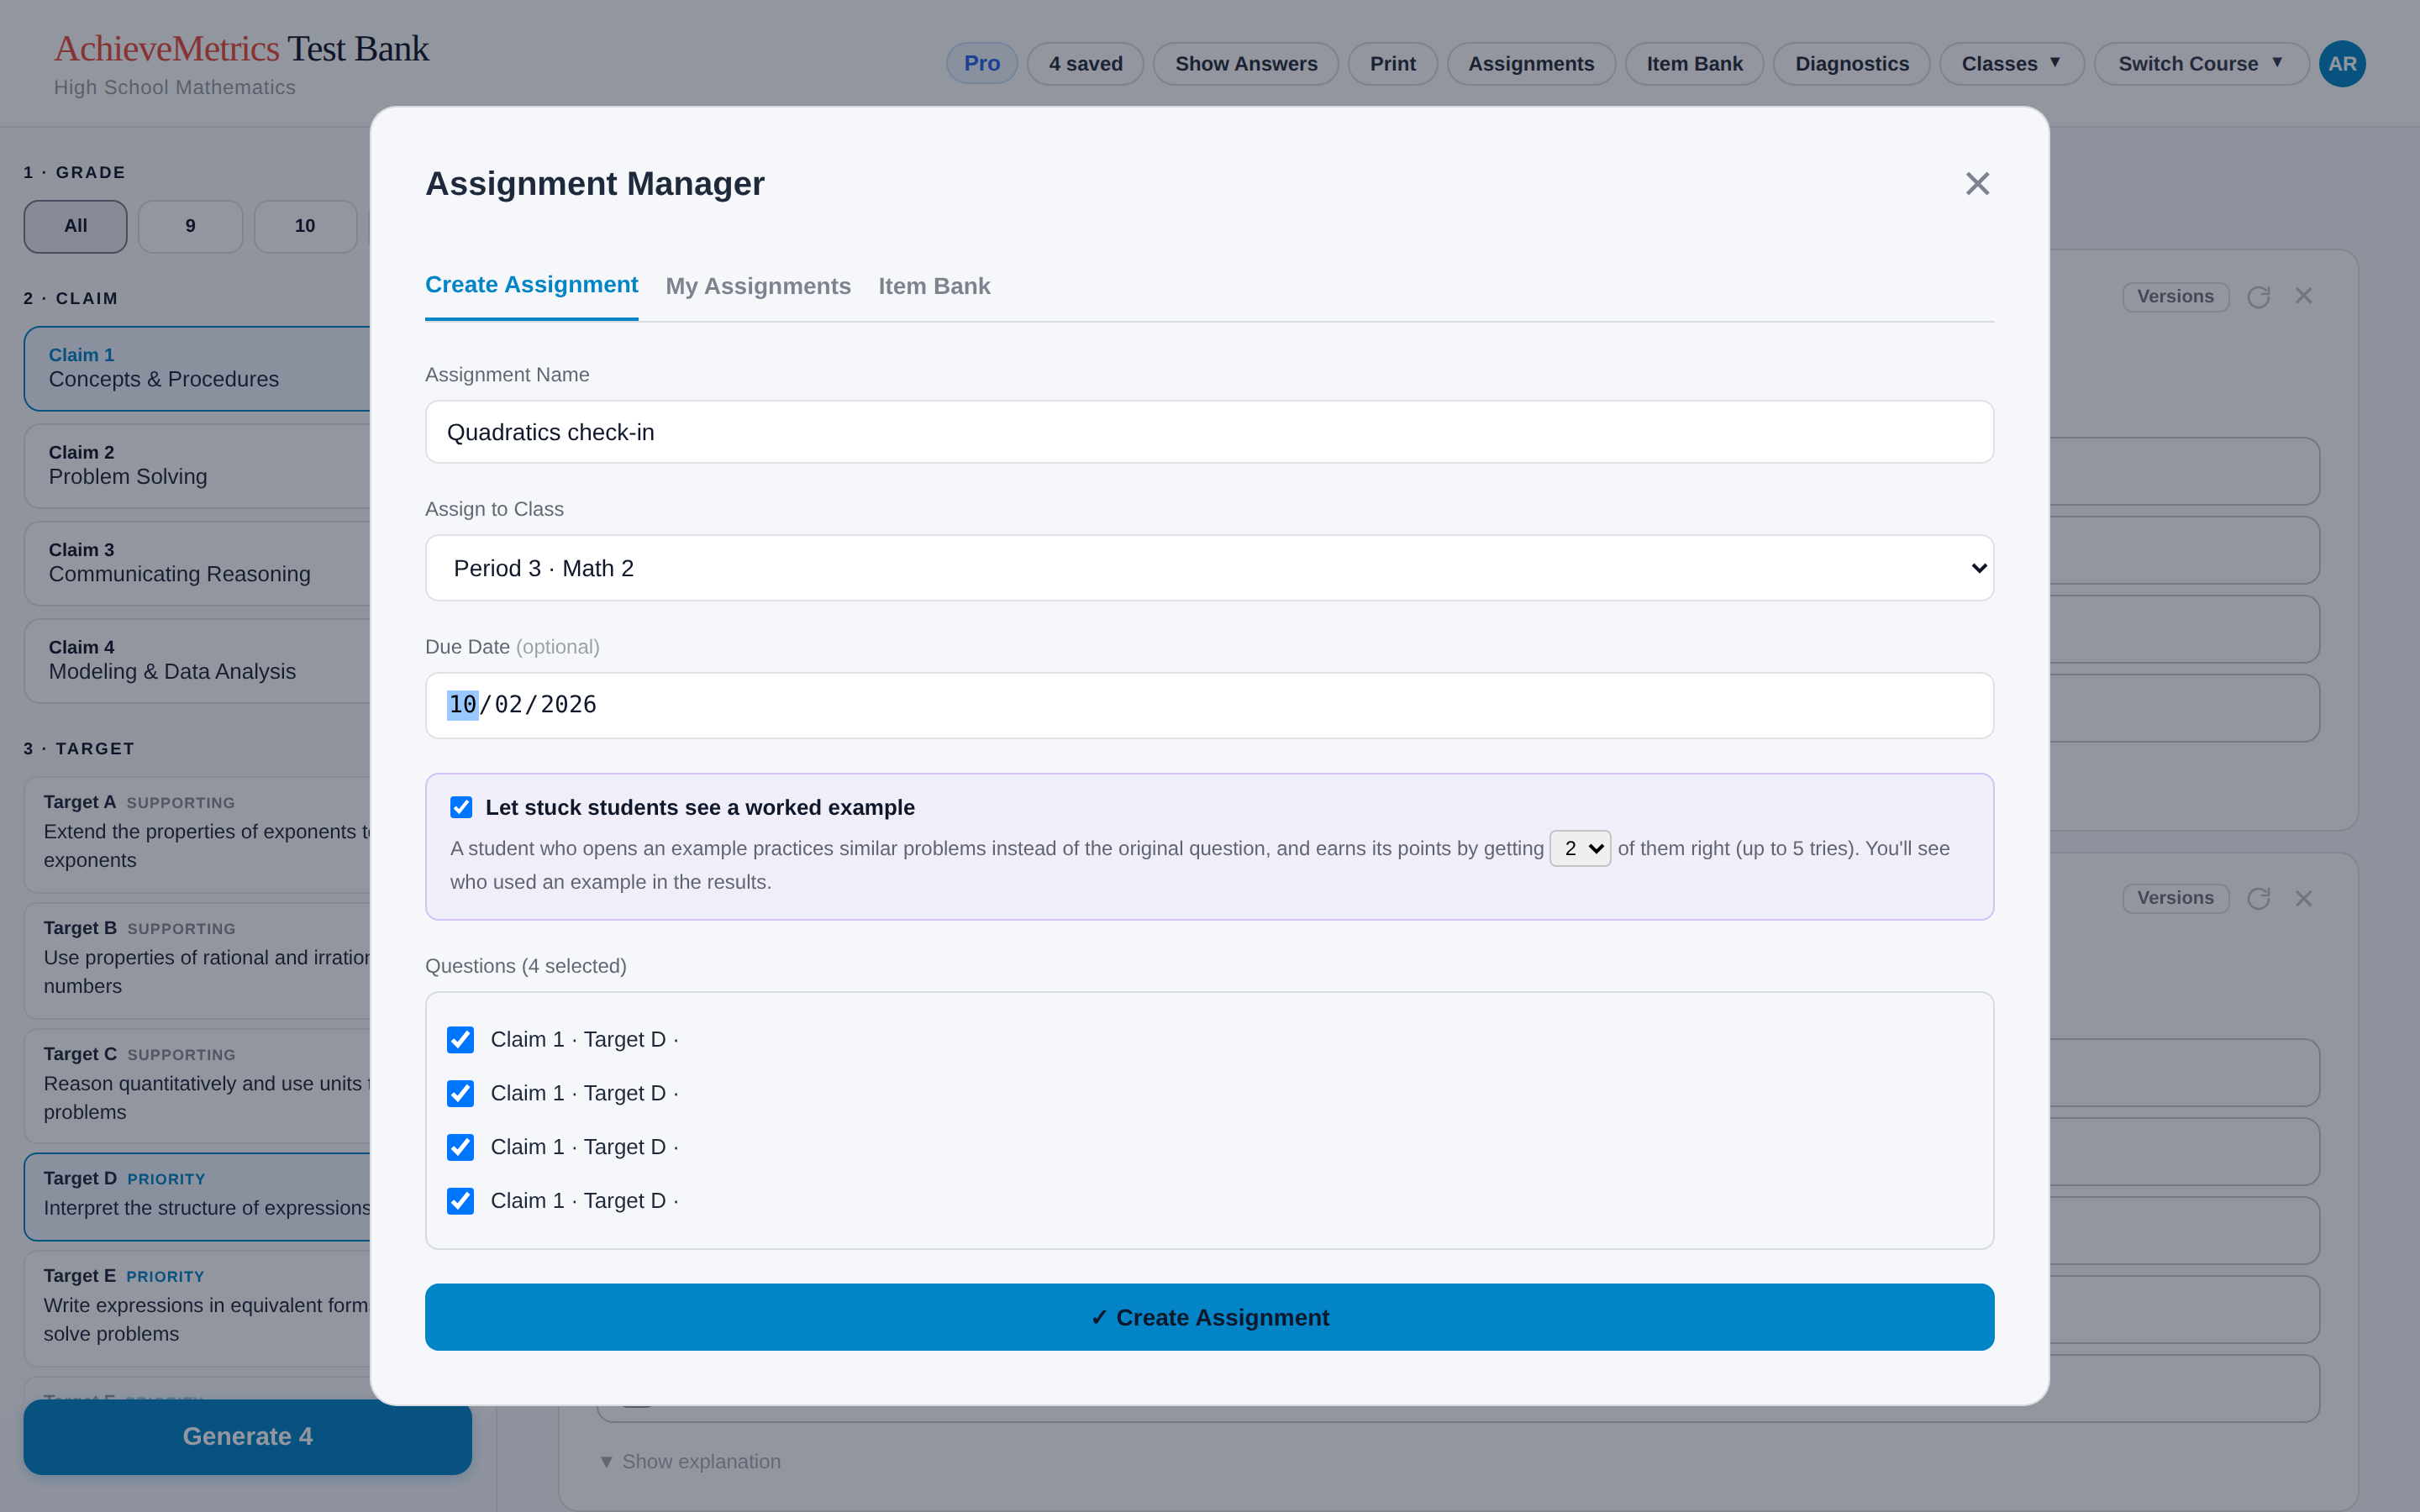
Open Assignments, name the set, pick a class and a due date, and tick the questions. Every item type is scored automatically. Written answers are scored 0–2 or 0–3 like the CAASPP and CAST scoring guides, and any answer that needs your judgment shows up in the Review tab of your class analytics.
Try it
Step 6
Assign an adaptive diagnostic
Open Diagnostics in the top bar. Choose a type (the full diagnostic, a quick check, or a single claim), pick the grade and class, and set a due date. Use Preview as student first. Each student gets an estimated scale score, an achievement level, results for each claim area, and every target.
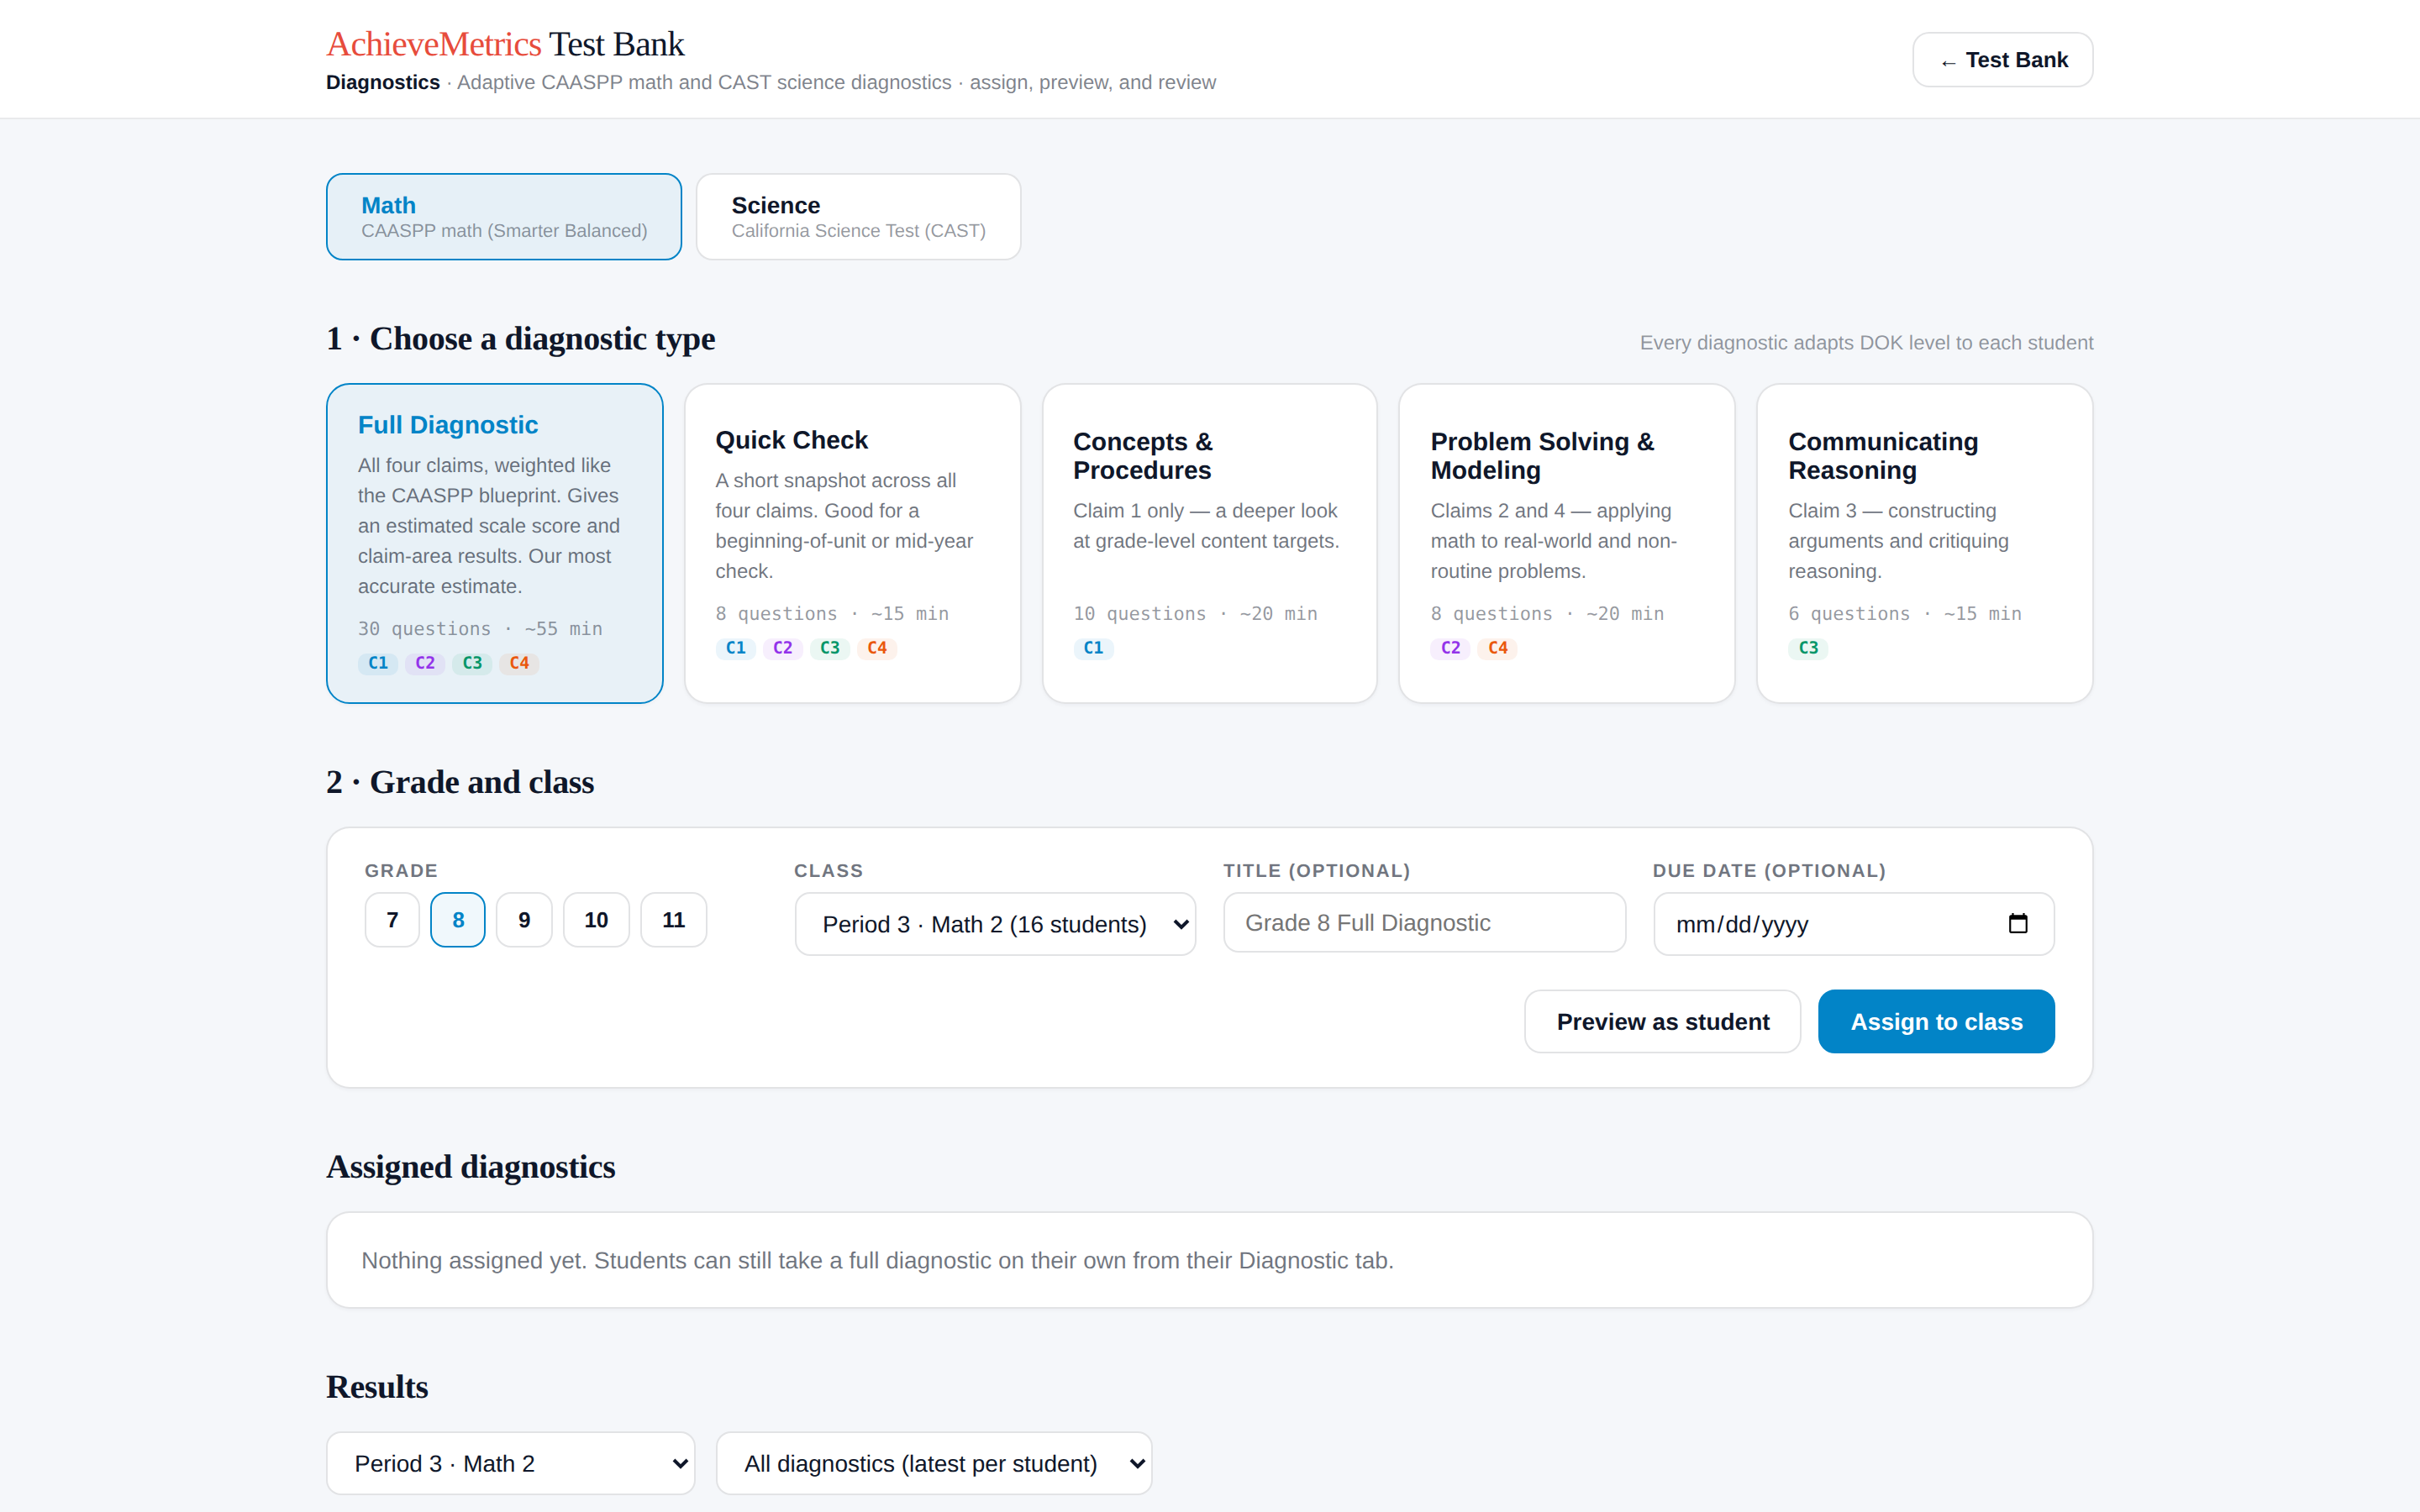
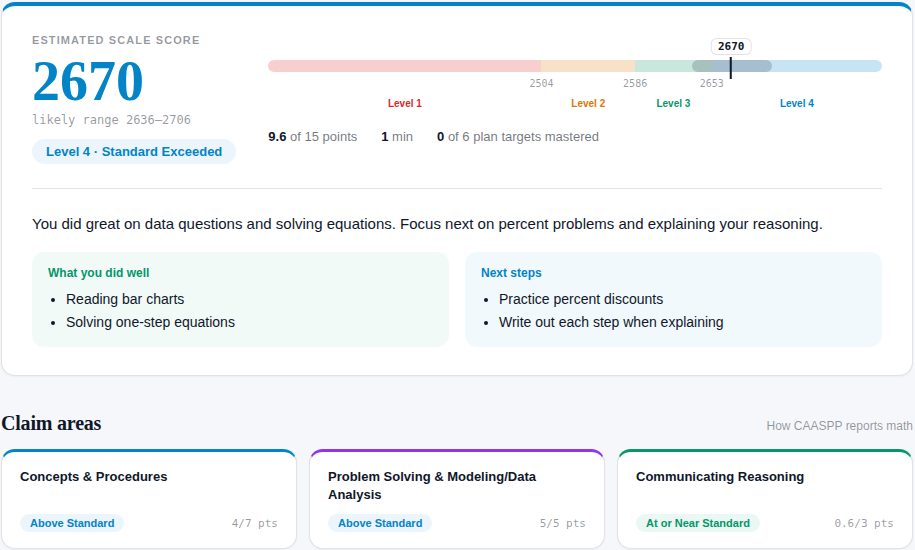
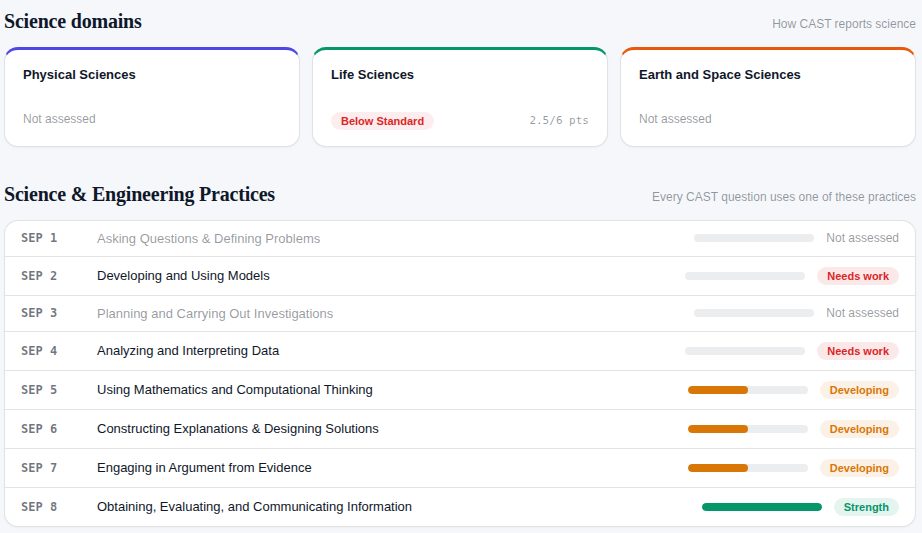
A diagnostic score is an estimate of how a student would score on the CAASPP or CAST. It is not an official score.
The research behind the scores
Blueprint first. Every math question traces back through a claim, a target, and a California standard to a Smarter Balanced task model. The four claims are reported as three areas, as on the CAASPP report.
DOK sets difficulty. DOK 1, 2, and 3 questions start at the official Level 1/2, 2/3, and 3/4 cut scores, so a student exactly at Standard Met answers a DOK 2 question correctly about half the time.
Adaptive, like the CAASPP. After each answer the ability estimate is updated, and the next question is the most informative one for that estimate.
Scored like the real test. A 2PL item response model (D = 1.7), ability by maximum likelihood, and the official scale transformation:
Scale score = 79.3 × θ + 2514.9 · range = score ± 79.3 × SE
Claim results use the score report’s 1.5 standard error rule: Above Standard if the whole range is above the Standard Met cut, Below if it’s entirely below, At or Near if it crosses.
CAST science is three-dimensional: each question combines a core idea, a science practice, and a crosscutting concept, using only the combinations the CAST blueprint samples. Scores use CAST’s model and scale (350–450 in grade 8, 550–650 in high school).
Sharper over time. Once 30 students answer a question, its difficulty is measured from their answers, the way Smarter Balanced and CAST calibrate field-test questions.
Try it
Step 7
Every diagnostic ends with a practice plan
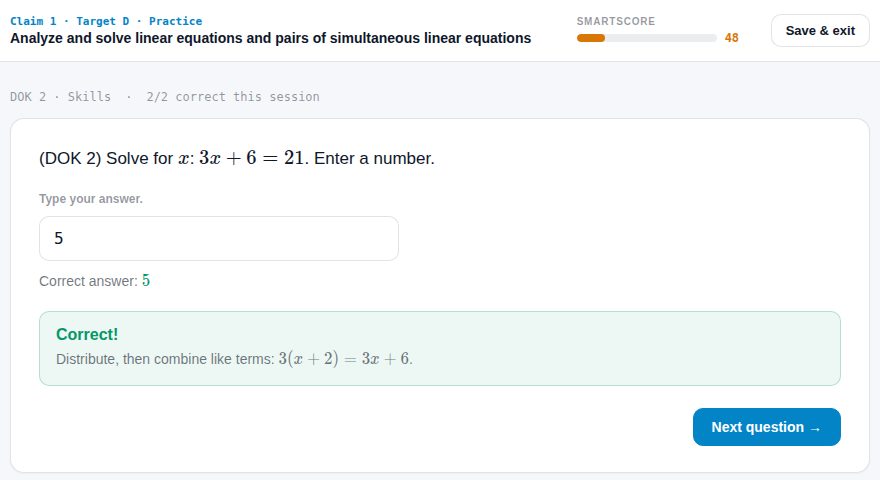
Students find a practice plan on their dashboard for the targets they missed. Practice gets harder after two right answers and easier after a miss, and a student reaches mastery at a SmartScore of 80. After a miss they see a step-by-step solution. You see their progress live.
Try it
Step 8
Read the analytics and plan your groups
Open Classes → Analytics and choose a class. The Class Snapshot shows one column per claim. Click a claim to see its targets. Colors follow the 0–4 achievement levels: a red row means a student needs help, and a red column means the whole class does.
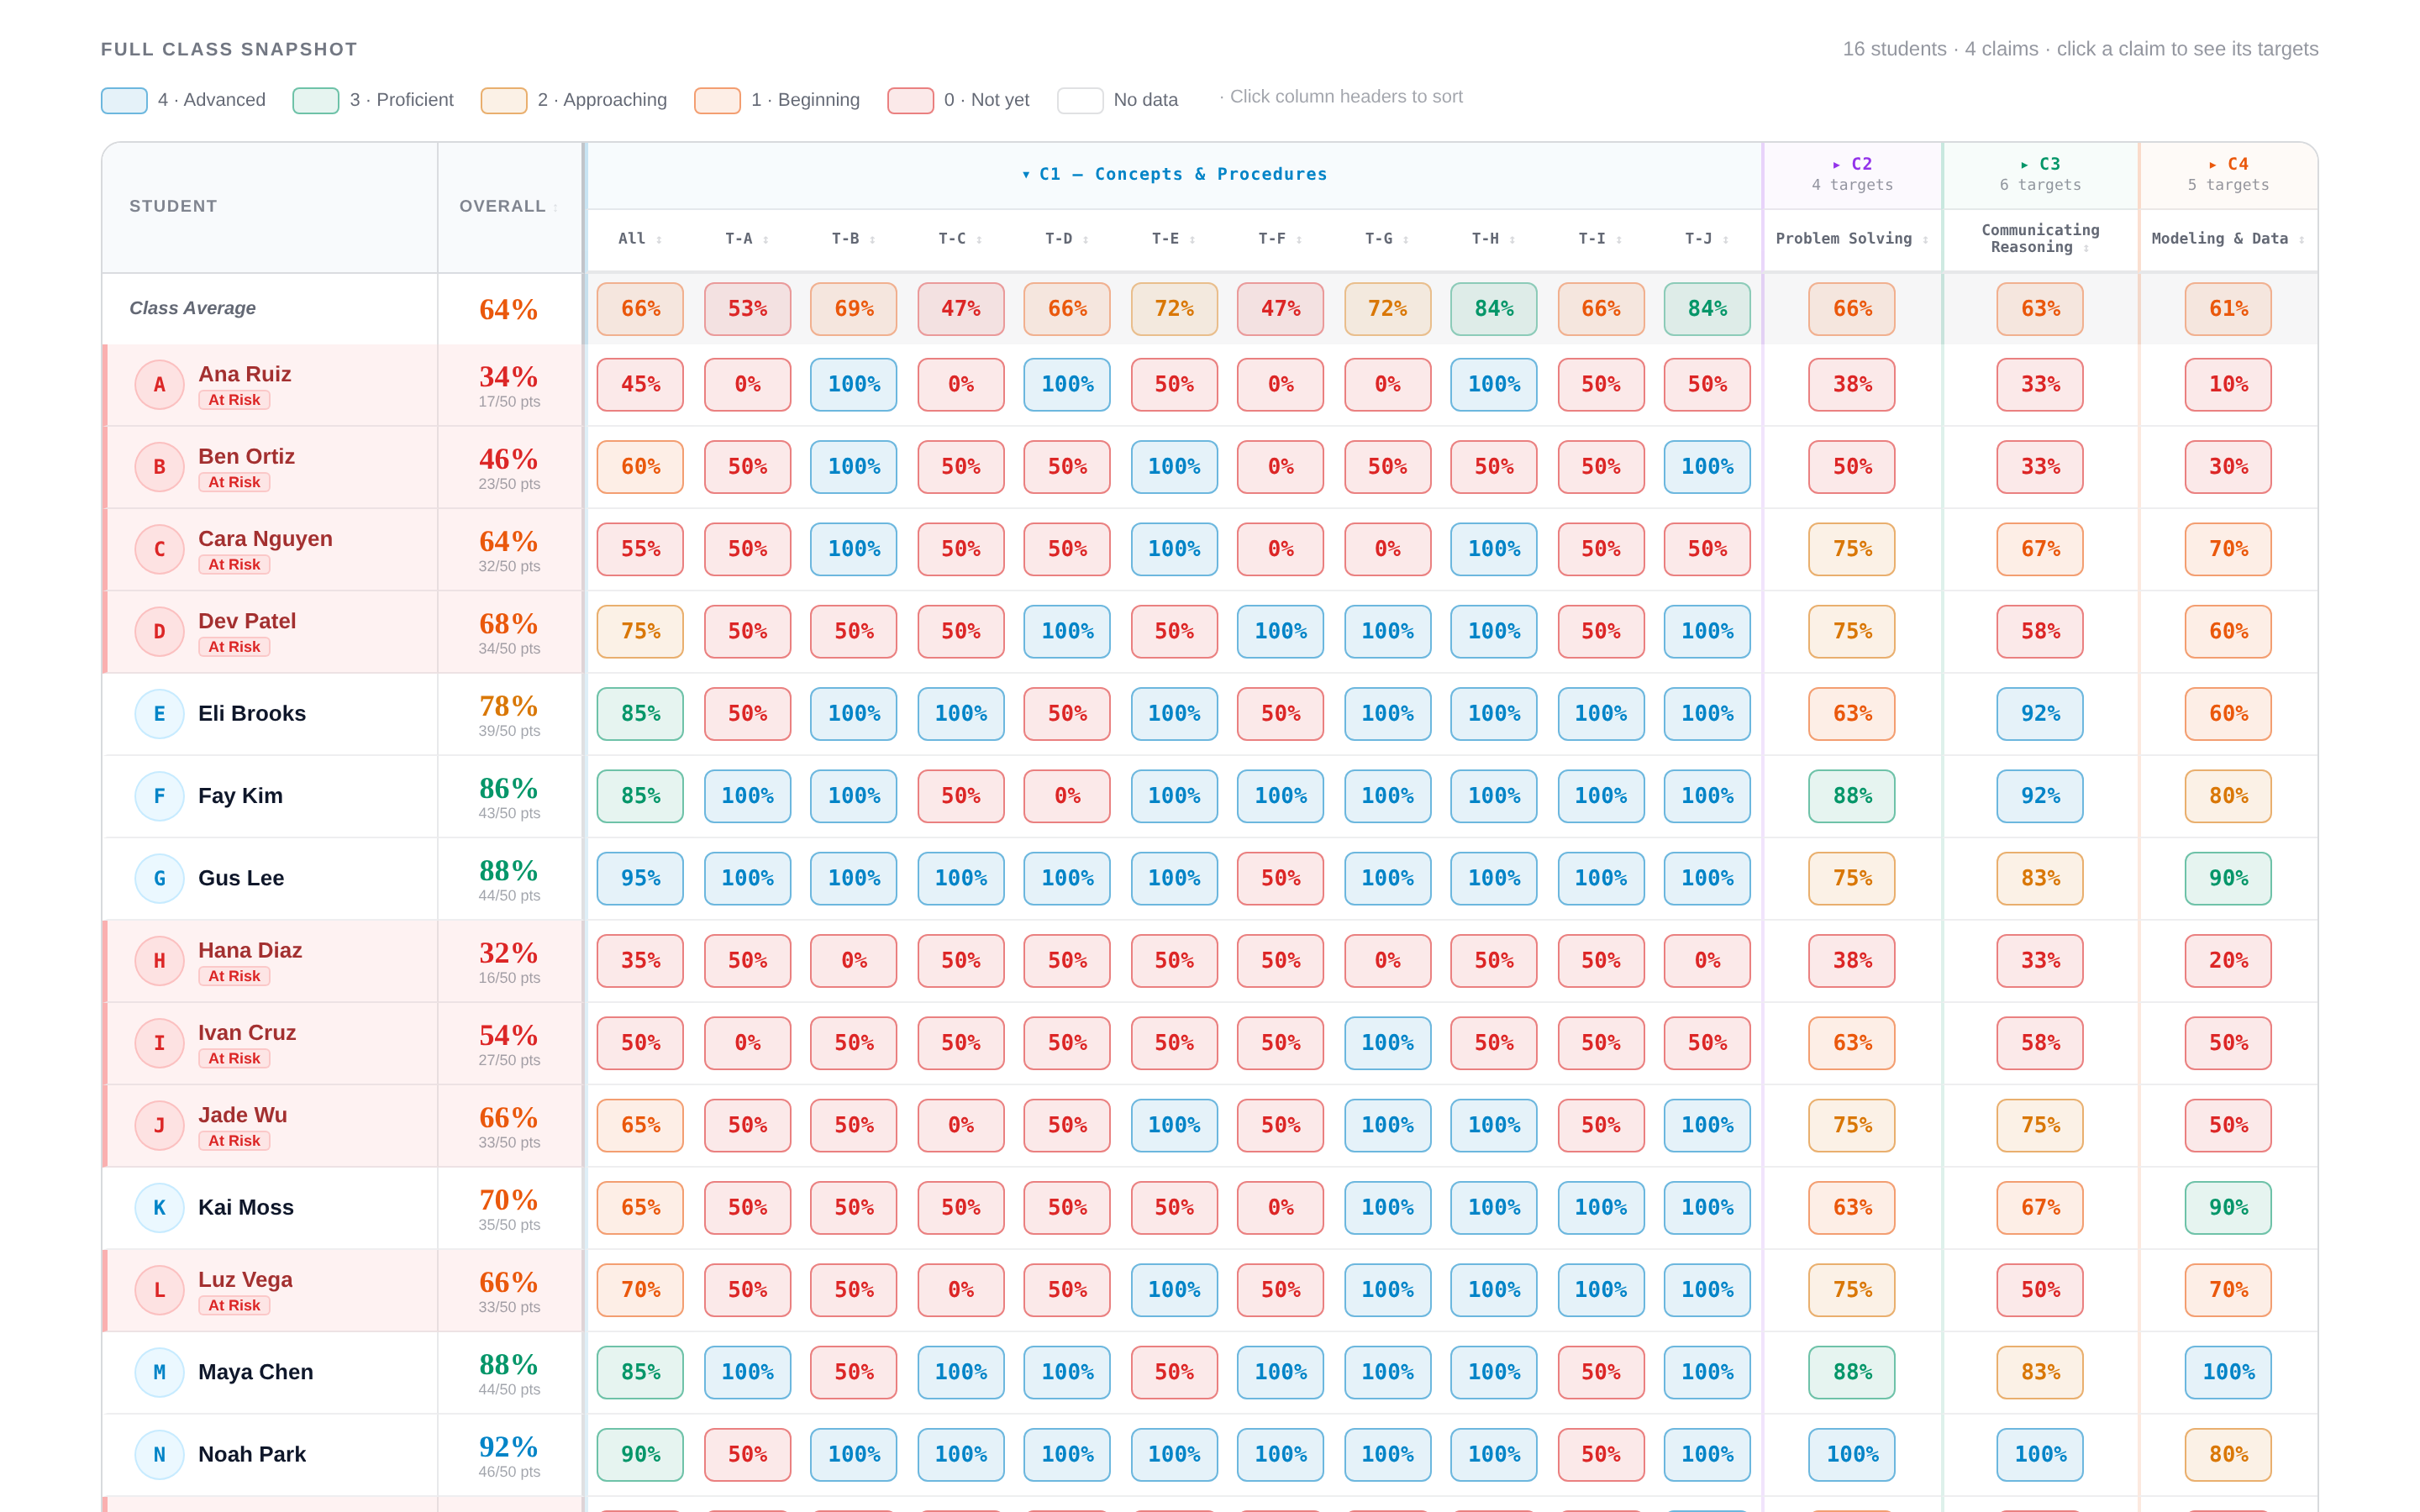
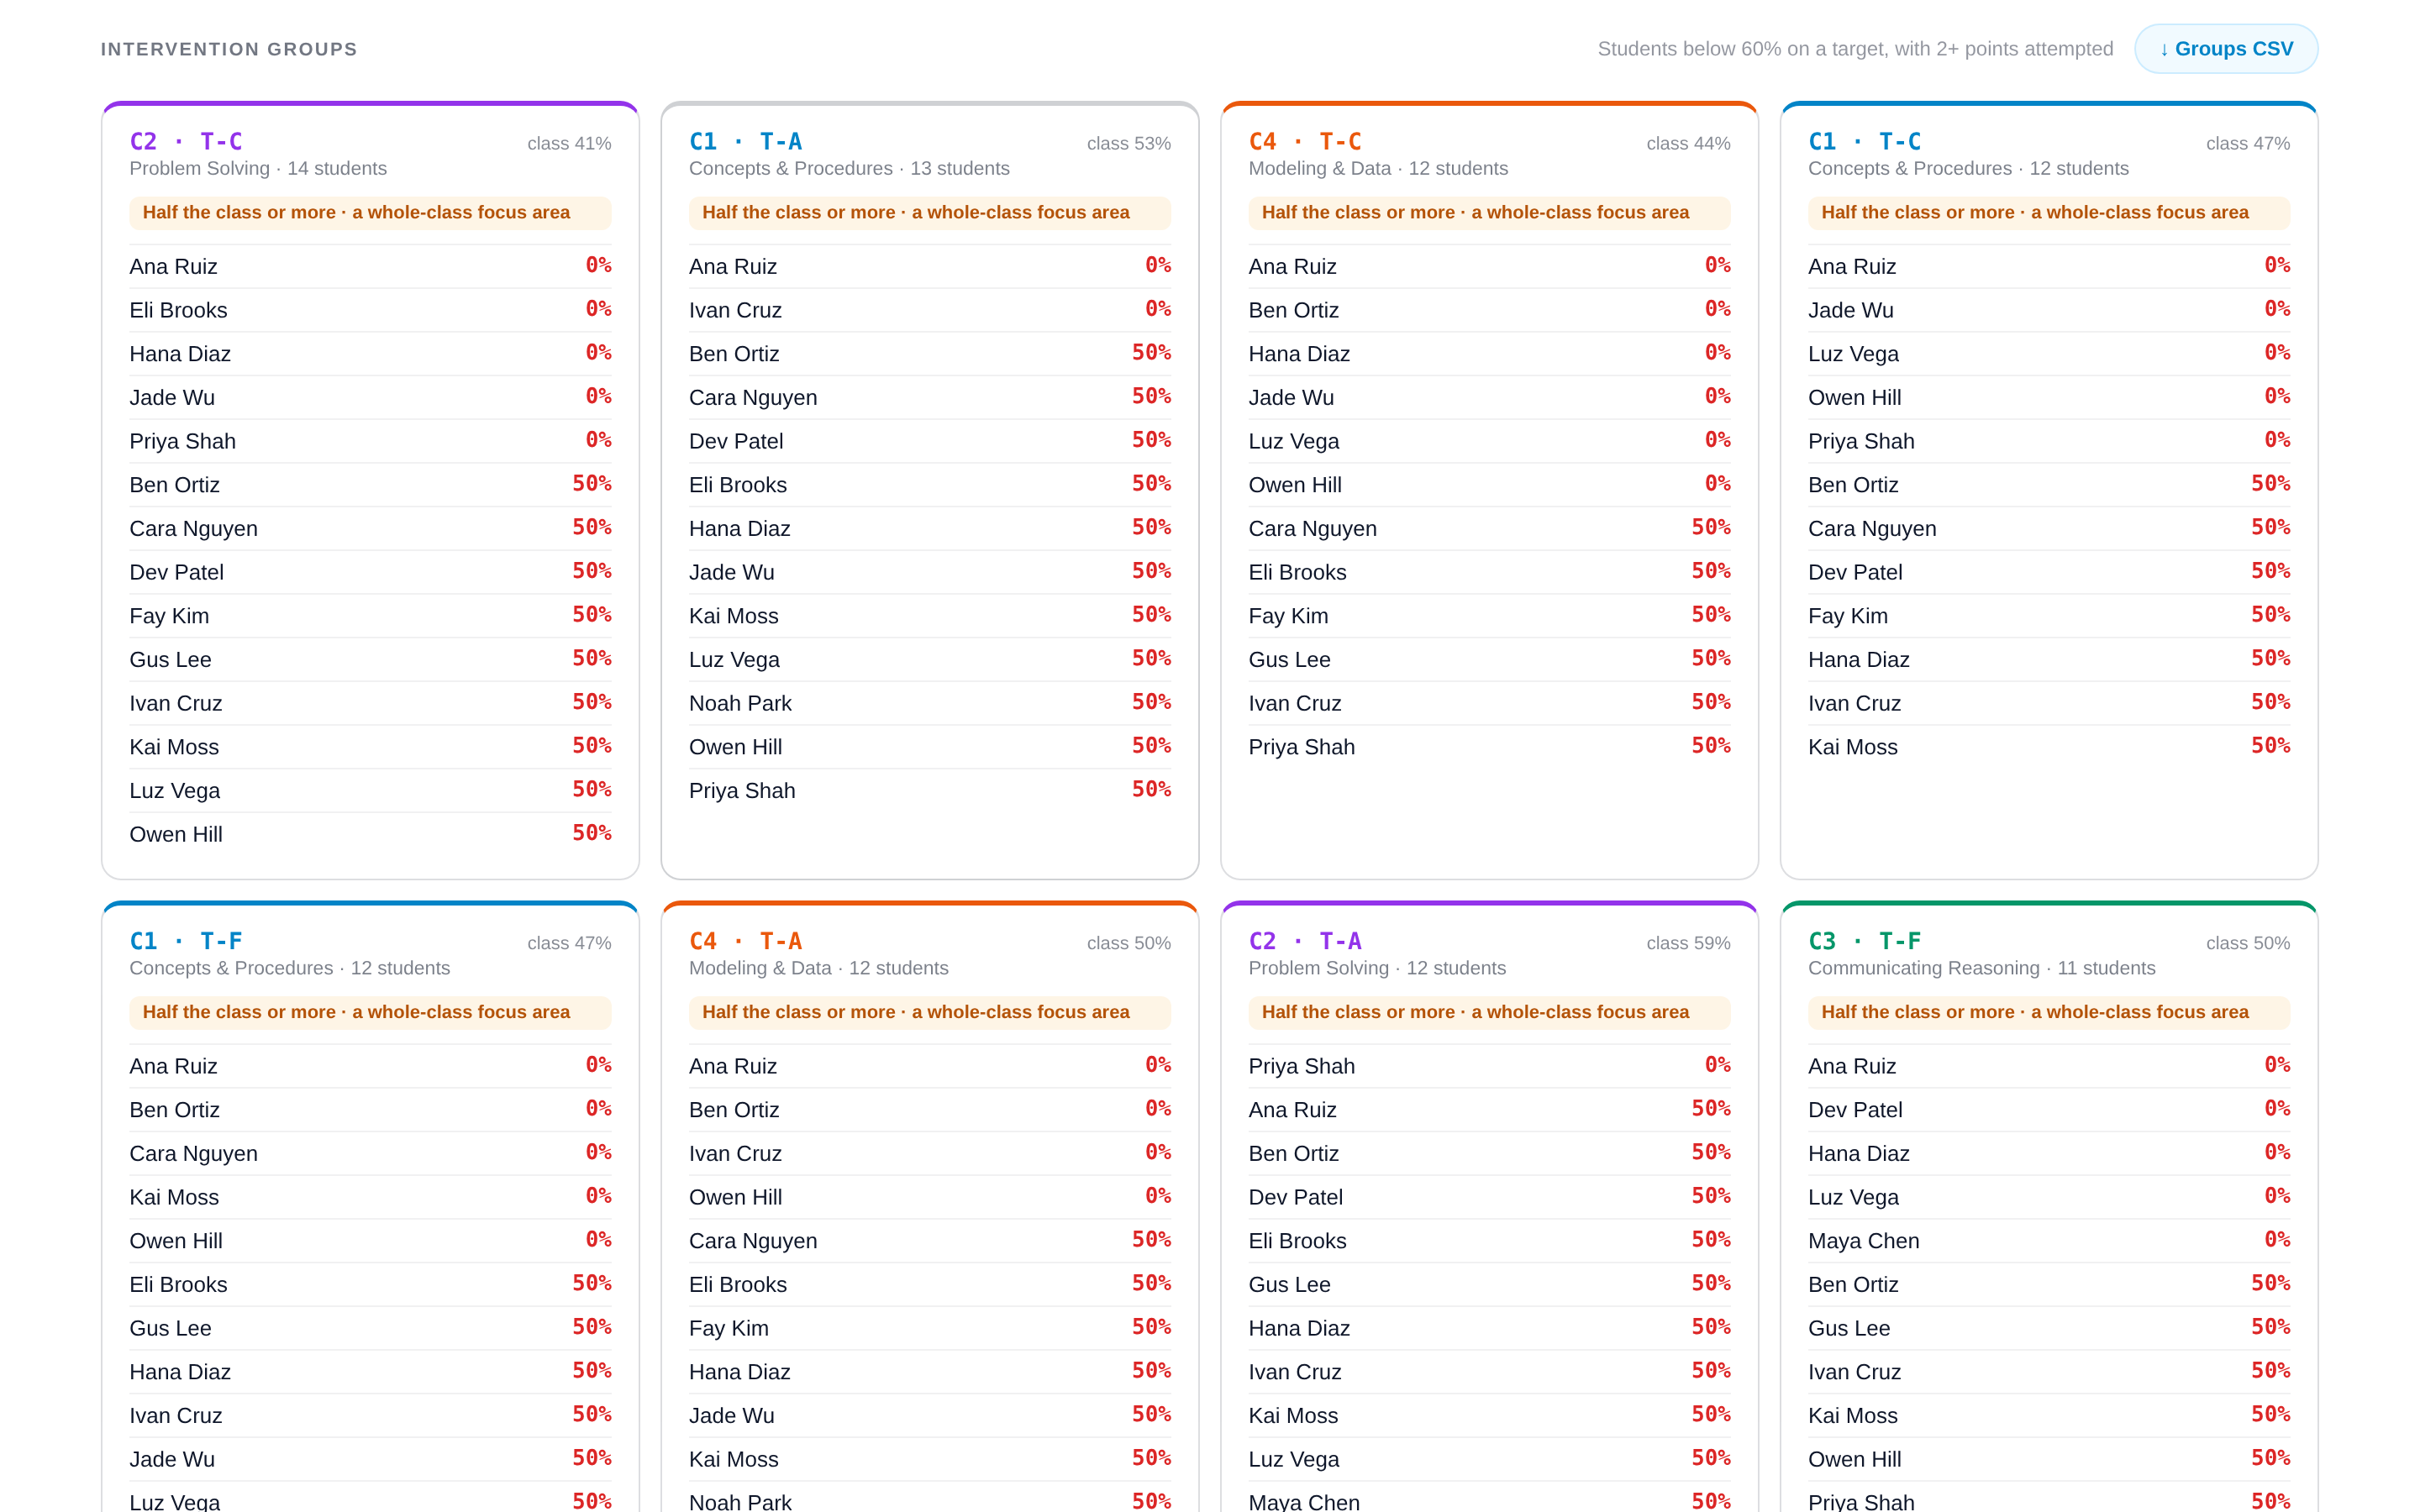
The Focus Areas & Groups tab lists every target from the lowest class score up, and groups the students below 60% on each one. When half the class or more is in a group, it’s flagged as a whole-class focus area.
Try it
Step 9
A routine that fits a unit
| When | What to do |
|---|---|
| Start of a unit | Assign a quick check or a single-claim diagnostic. |
| Next class | Open Focus Areas and teach the top focus area to everyone. |
| During the week | Pull intervention groups while students work their practice plans. |
| End of the week | Assign a short set on the focus targets and review written answers. |
| End of the unit | Diagnose again and compare. |
Try it
Step 10
You’re set up
Fill in your details to make a completion note you can send to your coach or principal.
Questions? Email achieve@achievemetrics.com. Go to the Test Bank →